
|

|
Authors:
Anicet Cosialls Manonelles, Aida Pallàs Ramos (16), Violeta Porta Alonso
(16), Alícia Tiffon Calvet (16).
School: IES GUINDÀVOLS, Eugeni d´Ors s/n , 25196 - Lleida (SPAIN) E-mail: |

|
||

|
| SUMMARY |
|
We have intended to give an answer to the questions mentioned below , after having taken the image of the annular eclipse of Sun on the 3rd October, 2005 by Josep Masalles and the image of the Venus transit on the 8th June , 2004 by the pupils of IES Guindàvols- the winners of Catch a Star 2004.
- Which distance is the Moon from the Earth at the moment of the eclipse?
- Which percentage of the solar disk is eclipsed by the Moon and by Venus in their corresponding eclipses?
It is known that the orbit of the Moon around the earth is not circular, but eliptical, and for that reason the distance from the Earth changes constantly in its orbital movement. The minimum distance perigee is 363.300 km and the maximum apogee is 405.500 km.
There is a solar eclipse in a determinate place of the Earth, when the Moon hides the Sun, at that spot of the Earth. This can only happen during the New Moon (Sun and Moon in conjunction) and it is presented different types of solar eclipse:
- Partial eclipse: The Moon does not completely cover the solar disk that turns up like a crescent.
- Total eclipse: The Moon covers totally the Sun, if it is observed from one determinate spot on the surface of the earth. Once out from that determinate spot the eclipse is partial. The total eclipse of Sun exists due to an extraordinary coincidence.
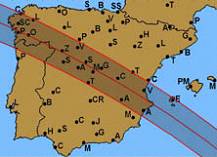
- Annular eclipse: It happens when the Moon is near the apogee and its diameter is minor than the solar one, so that in the maximum phase, a ring of the disk of the Sun remains visible. This happens in the band of annularity, out of that annularity the eclipse is partial. The last annular eclipse that has affected Spain occurred on 3rd October, 2005.
In order to have a total eclipse of Sun in a determinate
place of the Earth the three following conditions must be simutaneously
fulfilled:
|
|
| Figure 1. Spain annular eclipse
zone |
In this research essay we have intended to give answer to the following questions formulated both in the observations of the annular eclipse of Sun in Lleida (03-10-2005) and the Venus transit in Lleida too (08-06-2004):
- Which procedures do we have within our reach to observe the eclipse?
- Which distance must the Moon be situated from the Earth in order to produce a total eclipse of Sun in a detreminate point of the Earth?
- How can we determine experimentally, from the observation of the annular eclipse of Sun on 3rd October, 2005, the distance to the moon from the earth?
- How does the temperature change during the eclipse? How does the intensity of the sunlight change during the eclipse?
- How do dampness and speed wind change during the eclipse?
- Which maximum percentage of the surface of the Sun overshadows the Moon during the eclipse?
- Which particular differences are there between the annular eclipse (03-10-2005) and the Venus transit (08-06-2004) ?
- How can the data of the profile of the Moon surface during an annular eclipse be obtained using the telescope VLT of Paranal (Chile).
Solutions of the problems
- Special glasses, which are made out of standardized filters, which prevent from the harmful sunbeams, and a cardboard contour. This can be seen in fig.2.
- Video camera protected with a number 14 lead base soldering filter, which has the same function as the glasses of standardized filter. This can be seen in fig.3.
The distance where the moon has to be from the Earth at the moment the total eclipse is produced can be calculated .
If the moon is situated near the apogee (405.500 km), the eclipse will be annular.
3. How can the distance to the Moon from the Earth be experimentally determined -from the observation of the annular eclipse of Sun on 3rd October, 2005?
- To determine experimentally the distance to the Moon from the Earth the eclipse’s day, we will base upon the shot taken by Josep Masalles Roman at Villagordo del Cabriel (39º33'10" N - 1º28'26" W - 699 m) (fig.8). This photograph was taken by fitting together one Reflex camera to a telescope Meade ( D:125 mm, F:1250 mm).
- Doing a picture treatment with the Paint Sho Pro program we can obtain the percentage of the Sun’s diameter eclipsed by the moon.
- Now we’re going to measure the apparent diameters of the Sun and the Moon from the differences of the axis (x, y) of the extreme points.
- The obtained results are:
Applying again the Tahles’ theorem on the figures number 11 and 12 the following equalities are obtained:
The following conclusion can be inferred:
4. How does the temperature change during the eclipse? How does the intensity of the sunliht change during the eclipse?
Material:
The material used in this practice at the schoolplayground is:
The assembly of all the device has to be done on this way:
1st: In order to fasten the sensors, they have to be fixed by an adjusting nut, and all this must be fixed too to the tweezers which will be tied up to a base.(fig.1)
2nd:- Connect two sensors with the MultiLog PRO keyboard
3rd: -Turn on the keyboard and select the capture mode, in this case, one sample per each second during 10.000 seconds.
-Start measuring at the beginning of the eclipse and stop once it has finished.
4th:-Download and analyse the data in the computer with the MutiLab progamm’s help.
- PHOTOGRAPH OF THE ASSEMBLY:
- Data treatment:
Both, the data of temperature and light intensity must be downloaded and checked.
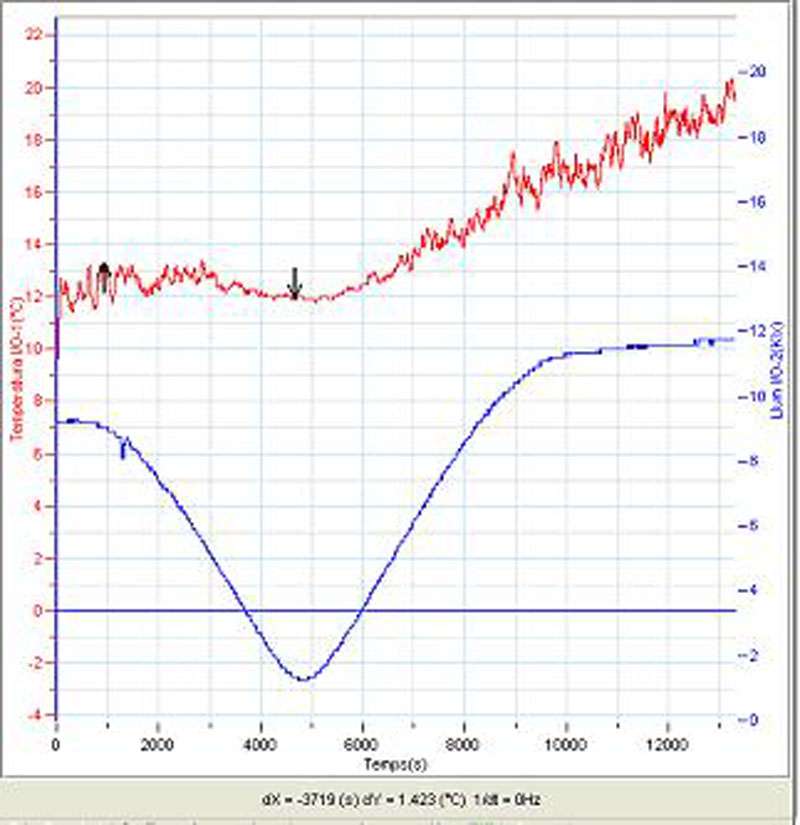
- Taking into account that we started registering the data at 07:41am, we can know the exact time when the Moon was totally opposite the Sun and thus when the annular eclipse was produced, at 09:01am . While commuting the first and the second cursor at the beginning and in the middle of the eclipse the descent of the intensity of light and the descent of temperature produced can be measured. (Fig.14 and 15).
- (As far as the light data are concerned we have to bear in mind that normally the light intensity is higher as the day advances;and for this reason, after the eclipse there is more light than at the beginning.
Not too much care must be given to the temperature data when wind gales are produced because they might cause some modifications on them)
- Sunlight intensity:
Maximum intensity: 9’315Klx
Minimum intensity: 1,215 Klx
Variations: Dllum = 8,1Klx => 87%
From the beginning to the moment when the annular eclipse took place , a descent in the intensity of light was produced- that is to say- a 87% less.
- Temperature:
Maximum temperature: 13,32 ºC
Minimum temperature: 11,799 ºC
Variation: Dt = 1,128 ºC => 8,47%
From the beginning to the exact moment of the annular eclipse the temperature has fallen 1,128ºC. we are talking about a reduction of an 8,47%
5. How do dampness and speed wind change during the eclipse?
- We have been able to observe that there was a reduction in the temperature and the intensity of light, and also in the dampness and the wind speed. The meteorological observatory of the city of Lleida gave us some information that was recorded during the eclipse. (Look at fig. 16a, 16b and 17). The information had been taken in solar schedule,. -two hours less than the time established in our zone.
- Figure 16 shows us the air dampness and temperature descent. Knowing that
these two factors were linked, we already supposed that a decrease in the air’s dampness will be produced- since a reduction of 1 degree took place during the eclipse.
- Which procedures do we have within our reach to observe the eclipse?
- Special glasses, which are made out of standardized filters, which prevent from the harmful sunbeams, and a cardboard contour. This can be seen in fig.2.
- Video camera protected with a number 14 lead base soldering filter, which has the same function as the glasses of standardized filter. This can be seen in fig.3.

|

|
| Fig. 2 Some pupils
looking at the eclipse |
Fig. 3 Video
camera protected with a solar filter |
- Thermoplastic soldering mask, which is composed
of a fixed, small and rectangular window with a special glass which
absorbes the ultraviolet radiation. This can be seen in fig.4.
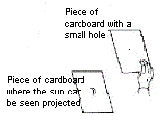
- If we do not have either any glasses or any system, two sheets of cardboard can be used instead. In one of them a small hole must be made and the light of the Sun that passes through this small hole has to be projected on the other sheet. This can be seen in fig.5.
- If we do not have either any glasses or any system, two sheets of cardboard can be used instead. In one of them a small hole must be made and the light of the Sun that passes through this small hole has to be projected on the other sheet. This can be seen in fig.5.

|
|

|
| Fig. 4 Mechanical
students with soldering masks |
Fig. 5 Method
with cardboards |
Fig. 6 Projection
of the eclipse through the leaves of the school playground trees. |

|

|

|

|
| Sequence
of the annular eclipse - Sony Digital Video Camara - LLeida (41º
37' 37'' N, 0º 36' 52´´ E, 170 m) |
|||
2. Which distance must the Moon be situated
from the Earth in order to produce a total eclipse of Sun in a detreminate
point of the Earth?
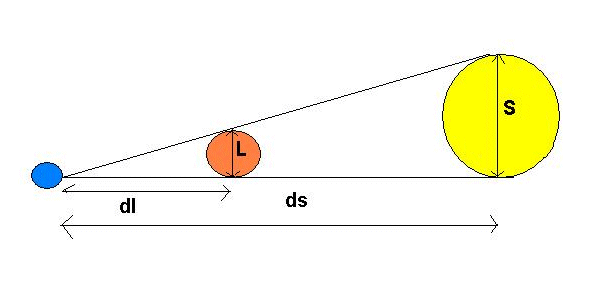
- In order to answer this question, we’ll suppose that the moon is aligned between the Earth and the Sun and in the same plane. Furthermore we’ll suppose that the sunlight propagates in the space in straight line).
Data:
Sun’s radius (S) = 696 000 km
Moon’s radius (L) = 1738 km
Average distance from the Earth to the Sun (ds) = 149.600.000 km
|
| Figura 7. Relative position
of the Earth, the Moon and the Sun in a total Sun’s eclipse |
| Applying the Thales’ theorem: |
The distance where the moon has to be from the Earth at the moment the total eclipse is produced can be calculated .
| dl = 373.570 km |
If the moon is situated near the apogee (405.500 km), the eclipse will be annular.
3. How can the distance to the Moon from the Earth be experimentally determined -from the observation of the annular eclipse of Sun on 3rd October, 2005?
- To determine experimentally the distance to the Moon from the Earth the eclipse’s day, we will base upon the shot taken by Josep Masalles Roman at Villagordo del Cabriel (39º33'10" N - 1º28'26" W - 699 m) (fig.8). This photograph was taken by fitting together one Reflex camera to a telescope Meade ( D:125 mm, F:1250 mm).

|

|
| Figure 8. Annular eclipse |
Figure 9. Meade
Telescope |
- Doing a picture treatment with the Paint Sho Pro program we can obtain the percentage of the Sun’s diameter eclipsed by the moon.
| Figure 10. Image treachment
with Paint Shop Pro program |
- Now we’re going to measure the apparent diameters of the Sun and the Moon from the differences of the axis (x, y) of the extreme points.
- The obtained results are:
| Apparent radius (length’s units) |
|
| Sun |
341 |
| Moon |
326 |
| Figure 11. Moon’s position in
a total Sun’s eclipse |
| Figure 12. Moon’s position in an annular solar eclipse |
Applying again the Tahles’ theorem on the figures number 11 and 12 the following equalities are obtained:
The following conclusion can be inferred:
dl =390.766 km
4. How does the temperature change during the eclipse? How does the intensity of the sunliht change during the eclipse?
Material:
The material used in this practice at the schoolplayground is:
- Temperature sensor with a sensibility of 0,001 ºC
- Light sensor with a sensibility of 0,001 Klx
- MultiLog PRO keyboard
- Two supports with nuts and two tweezers
- In the classroom .
- A computer with the MultiLab program is required
The assembly of all the device has to be done on this way:
1st: In order to fasten the sensors, they have to be fixed by an adjusting nut, and all this must be fixed too to the tweezers which will be tied up to a base.(fig.1)
2nd:- Connect two sensors with the MultiLog PRO keyboard
3rd: -Turn on the keyboard and select the capture mode, in this case, one sample per each second during 10.000 seconds.
-Start measuring at the beginning of the eclipse and stop once it has finished.
4th:-Download and analyse the data in the computer with the MutiLab progamm’s help.
- PHOTOGRAPH OF THE ASSEMBLY:

|
| Figure 13. Assembly Experience |
- Data treatment:
Both, the data of temperature and light intensity must be downloaded and checked.
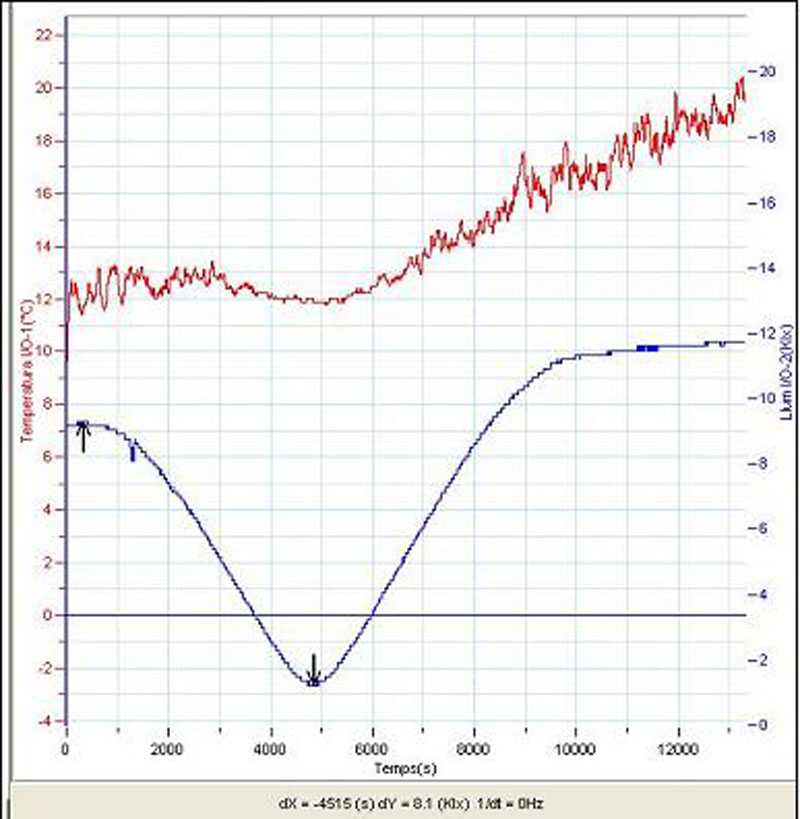
- Taking into account that we started registering the data at 07:41am, we can know the exact time when the Moon was totally opposite the Sun and thus when the annular eclipse was produced, at 09:01am . While commuting the first and the second cursor at the beginning and in the middle of the eclipse the descent of the intensity of light and the descent of temperature produced can be measured. (Fig.14 and 15).
|
|
| Figure 14. graphic
1 |
Figure 15. graphic
2 |
- (As far as the light data are concerned we have to bear in mind that normally the light intensity is higher as the day advances;and for this reason, after the eclipse there is more light than at the beginning.
Not too much care must be given to the temperature data when wind gales are produced because they might cause some modifications on them)
- Sunlight intensity:
Maximum intensity: 9’315Klx
Minimum intensity: 1,215 Klx
Variations: Dllum = 8,1Klx => 87%
From the beginning to the moment when the annular eclipse took place , a descent in the intensity of light was produced- that is to say- a 87% less.
- Temperature:
Maximum temperature: 13,32 ºC
Minimum temperature: 11,799 ºC
Variation: Dt = 1,128 ºC => 8,47%
From the beginning to the exact moment of the annular eclipse the temperature has fallen 1,128ºC. we are talking about a reduction of an 8,47%
5. How do dampness and speed wind change during the eclipse?
- We have been able to observe that there was a reduction in the temperature and the intensity of light, and also in the dampness and the wind speed. The meteorological observatory of the city of Lleida gave us some information that was recorded during the eclipse. (Look at fig. 16a, 16b and 17). The information had been taken in solar schedule,. -two hours less than the time established in our zone.

|
|
Fig.16a.
Dampness graphic Fig.16b.
Temperature graphic |
- Figure 16 shows us the air dampness and temperature descent. Knowing that
these two factors were linked, we already supposed that a decrease in the air’s dampness will be produced- since a reduction of 1 degree took place during the eclipse.
Comparison between an annular eclipse and the Venus transit
6 -7.Comparison between an annular eclipse (03-10-2005) and theVenus transit (08-06-2004).
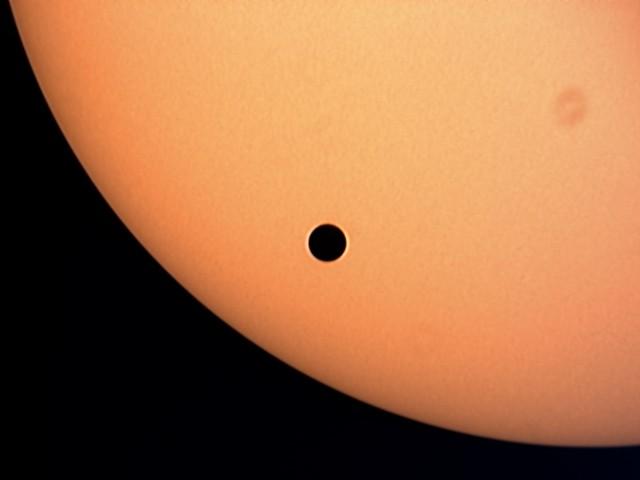
- A transit happens when a planet places in front of the Sun. Only Mercury (See fig.18) and Venus (See fig.19) can be nearer the Sun than the Earth, consequently, they can transit in front of the Sun.
|

|
|
|
Fig. 18. Mercury transit.
(Photo by theWinners of “Catch a Star 2004”)
|
Fig. 19. Venus transit (Photo
by theWinners of “Catch a Star 2004”)
|
Fig. 20. Solar
Eclipse. |
- An eclipse is a total or partial conceal of a star’s light. It happens when some other star is between the first one and the observer. In a Sun’s eclipse, the Moon is between the Sun and the Earth. The Sun’s diameter is 400 times bigger than the Moon’s one , but it is 400 times further; therefore that is the reason why in size they are apparently similar. ( See fig 20).
| Time of the first
contact (TU) |
Time of the fourth
contact (TU) |
Length (hh:mm:ss) |
Surface eclipsed (%)
|
Reduction of the intensity of light (%)
|
Reduction of the temperature (ºC)
|
|
| The Venus transit |
05:21:15 |
11:24:35 |
06:03:20 |
0,1 |
- |
0 |
| Sun’s eclipse |
09:01 |
10:23 |
02:41:39 |
91 |
87 |
1,1 |
|
Fig. 21. The annular eclipse versus the Venus transit |
Observations with the ESO VLT telescope
8. How to obtain information about the surface of the Moon during an annular eclipse using the telescope VLT from Paranal (Chile).
The VLT telescope is the best one of the European astronomy at the moment and the main one from the new observatory of ESO in Paranal. It is also the one that has the most sophisticated devices in the world.
The VLT does not only consists in one telescope., but some interconnected. The main elements are 4 reflecting telescopes with primary mirrors of 8,2 m of diameter. The 4 telescopes are situated forming a trapeze. There are 4 more telescopes which are mobile, measuring 1,8 m able to see a man walking on the Moon.
- This telescope (fig.22) makes possible the observation of the Baily’s pearls (fig.24) during an annular . Baily’s pearls are the last rays of light going through valleys and mountains in the Moon. Scientists highly appreciate to observe and chronometre with precision the first and the last instants of the first and last pearls, because this allows them to rebuilt exactly the surface of the Moon.
However, lhe annular eclipse couldn’t be seen from “Cerro Paranal”

|

|

|
| Fig. 22. VLT
Telescope, Chile |
Fig.23.
Inside the Paranal observatory |
Fig. 24.
Baily's pearls |
Conclusions
- We can observe an annular eclipse in 5 different ways: Using special glasses, a video-camera protected with a soldering filter, a soldering mask, the projecting the solar trough the leaves holes of the trees, and using a fine cardboard.
- The Moon and the Earth have to be at 373.570 km in order to take place a total eclipse.
- The distance between the Moon and the Earth during the eclipse on October 3rd, 2005 was 390.766 km.
- The surface of the solar disk has been eclipsed a 91 %
- The time between the first and the last contact of the Venus transit was longer than the time during the annular eclipse.
- The temperature slowed down 1,128º C during the eclipse, and there was a reduction of about 87% of the intensity of the light and there was also a relative dampness increase.
- The wind speed diminished during the eclipse which is a consequence of a decrease in the temperature.
Photo Gallery

|

|

|

|

|

|

|

|

|

|
References
Personal webpage of Josep Masalles:
http://www.ictisp.com/~jmasalle/
"8 th june ¡Let´s to observe!" (Winners of Catch a Star 2004):
http://www.eso.org/outreach/eduoff/edu-prog/catchastar/casreports-2004/rep-228/
Instituto Astrofísico de Canarias (IAC):
http://www.iac.es/educa/eclipses/anular/3octubre05/index.html
http://www.iac.es/educa/eclipses/unidad.pdf
http://www.iac.es/educa/sol/actividad.htm
European Southern Observatory (ESO)
http://www.eso.org/outreach/ut1fl/
- To Josep Masalles, for having given us the photograph of the annular eclipse.obtained with his telescope.
- To the meteorological observatory of Lleida and to Armand Àlvarez for having treated us so kindly.
- To Rosa Borrell Feliu, thanks for correcting and revising the English version of the text.
- To Juanjo González for his help in filming the eclipse.
- To Carles Porta and Florence Henrard for the animation of the eclipse.
- To Gerard Mor and Joan Portillo, for having accompanied us to the Lleida metereological observatory .

